Contact

What Is a Good Email Open Rate in the UK?

The short answer: it depends on your industry, your list and how opens are being measured.

This guide sets out average open rates for email marketing by industry from published studies. It explains why opens are less reliable than they used to be and which numbers tell you more. Every benchmark on this page names its source and date.

Headline UK email benchmarks

35.9%Average UK open rateSource: DMA Email Benchmarking Report 2025
2.3%Average UK click rateSource: DMA Email Benchmarking Report 2025
0.22%Average unsubscribe rate (global)Source: Mailchimp benchmarks, December 2023

What is a good open rate for email marketing?

A good open rate is one that sits at or above the average for your industry and holds steady or rises over time. Published averages vary a lot between studies, because each one measures different senders in different ways.

In the UK, the DMA's Email Benchmarking Report 2025 puts the average open rate at 35.9% for emails sent in 2024.

Engaged audiences do much better. Many healthy Klaviyo accounts see campaign open rates between 35% and 60% for engaged audiences. Compare yourself with your own trend first and with industry averages second.

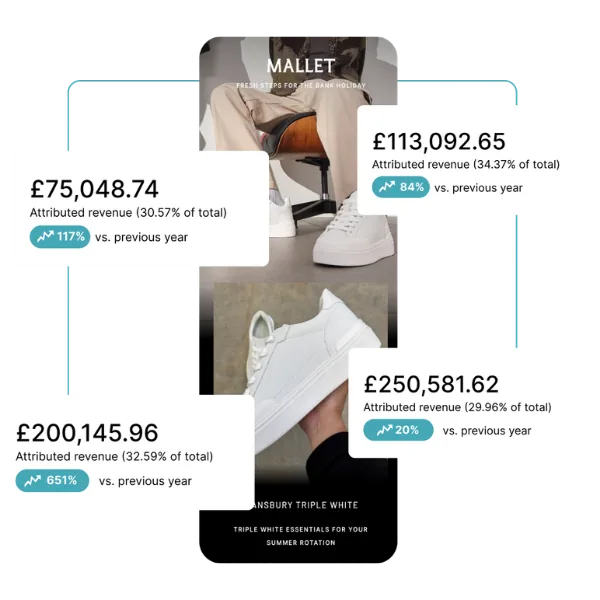
Klaviyo results dashboard showing email revenue

Why are open rates less reliable than they used to be?

Apple's Mail Privacy Protection lets Apple Mail load emails in the background, whether or not anyone reads them. Those loads count as opens. Other privacy tools and image blocking skew the numbers too, sometimes up and sometimes down.

So a high open rate can flatter a weak list. A sudden drop can mean a tracking change rather than a real problem.

Treat opens as an early warning for deliverability, not as proof an email worked. Clicks, orders and revenue per recipient tell you far more.

UK and global email benchmarks

The UK average comes from the DMA. The DMA doesn't publish unsubscribe rates openly, so for those and for industry figures we show Mailchimp's global benchmarks and say so.

UK and global email benchmarks: average open, click and unsubscribe rates with sources
SectorAverage open rateAverage click rateAverage unsubscribe rateSource
All UK email (B2B and B2C)35.9%2.3%Not publishedDMA Email Benchmarking Report 2025 (UK, 2024 data)
eCommerce (global)29.81%1.74%0.19%Mailchimp email marketing benchmarks (December 2023)
Business and finance (global)31.35%2.78%0.15%Mailchimp email marketing benchmarks (December 2023)
Non-profits (global)40.04%3.27%0.18%Mailchimp email marketing benchmarks (December 2023)
Education and training (global)35.64%3.02%0.18%Mailchimp email marketing benchmarks (December 2023)
All industries (global)35.63%2.62%0.22%Mailchimp email marketing benchmarks (December 2023)

Figures checked November 2026.

What about click rate, conversion rate and revenue per recipient?

Opens tell you whether people saw the email. These three tell you whether it worked.

Click rateThe share of recipients who clicked. A far better test of your content and offer than opens. The UK average unique click rate was 2.3% in 2024 (DMA Email Benchmarking Report 2025).
Conversion rateThe share of recipients who went on to buy or enquire. It depends on your website as much as your email.
Revenue per recipientRevenue from the email divided by the number of people it went to. It's the fairest way to compare a big send with a small, targeted one.

We report on revenue and engagement, not vanity metrics. We're careful with attribution too. Reporting windows can over-credit or under-credit email, so we look at the whole customer journey before calling a winner.

What is a healthy unsubscribe and spam complaint rate?

  • Unsubscribes are normal. Someone leaving quietly does far less damage than someone marking you as spam. A rising unsubscribe rate usually means you're sending too often or to the wrong people. There's no openly published UK unsubscribe benchmark. Mailchimp's global average across all industries is 0.22% (Mailchimp benchmarks, December 2023).
  • Spam complaints matter more. Google's email sender guidelines ask senders to keep their spam rate in Postmaster Tools below 0.1% and never let it reach 0.3% (checked November 2026). Go over it and your emails can start landing in spam for everyone, not only the people who complained.

What do we see in Klaviyo accounts?

Many healthy Klaviyo accounts see campaign open rates between 35% and 60% for engaged audiences. That range is for engaged segments, not whole lists, so it won't line up with an industry average across every subscriber.

What separates the strong accounts isn't one clever trick. It's clean data, proper authentication, sending to people who want to hear from you and testing something every month.

How do you improve your open rate?

  1. Fix deliverability first.

    If your emails land in spam, nothing else on this list matters. Check SPF, DKIM and DMARC are in place, then stop sending to people who never engage. Here's how we improve deliverability for Klaviyo brands.

  2. Segment your list.

    Send more often to engaged subscribers and less often to quiet ones. We show you how to segment so the right people get the right emails.

  3. Test subject lines.

    Change one thing at a time and judge the winner on clicks or revenue, not opens alone. Our campaign team will test on every send.

  4. Send when your audience reads.

    There's no single best time for every list. Test send times against revenue, then keep testing.

  5. Earn the open.

    Use a sender name people recognise and preview text that adds to the subject line rather than repeating it.

How do you calculate your email metrics?

Benchmarks only help if you're measuring the same way. These are the standard calculations.

How do you calculate your email metrics?
Open rate:Unique opens divided by emails delivered. Delivered, not sent, so bounces don't drag it down.
Click rate:Unique clicks divided by emails delivered.
Click-to-open rate:Unique clicks divided by unique opens. Useful for judging the content once someone has opened.
Unsubscribe rate:Unsubscribes divided by emails delivered.
Spam complaint rate:Complaints divided by emails delivered.
Revenue per recipient:Revenue attributed to the email divided by the number of people it was delivered to.

Platforms don't all define these the same way. Some count total opens rather than unique opens, or use different attribution windows for revenue. Before you compare yourself with a benchmark, check how your platform calculates each one.

A worked example

Here's how the numbers fit together for an illustrative campaign. The figures are made up to show the maths, not taken from a client.

A campaign goes to 20,000 people and 19,600 are delivered.

  • 7,000 unique opens gives an open rate of 35.7%.
  • 450 unique clicks gives a click rate of 2.3% and a click-to-open rate of 6.4%.
  • 40 unsubscribes gives an unsubscribe rate of 0.20%.
  • 10 spam complaints gives a complaint rate of 0.05%, below Google's 0.1% guideline.
  • £4,900 of attributed revenue gives revenue per recipient of £0.25.

On those numbers the campaign sits close to the published averages on opens, clicks and unsubscribes. The figure worth tracking over time is the £0.25. If next month's send has a lower open rate but a higher revenue per recipient, it did better.

Why do your numbers look different from the benchmarks?

A gap between your figures and a published average isn't automatically good or bad. Common reasons include:

  • Who you send to.

    Sending only to engaged subscribers lifts open and click rates. Sending to everyone lowers them.

  • Campaigns versus flows.

    Automated flows are triggered by what someone just did, so they usually perform better than campaigns. Benchmarks often mix the two.

  • How opens are counted.

    Apple Mail Privacy Protection and image blocking change open rates in ways that differ from list to list.

  • List age and source.

    A list built from recent customers behaves differently from one built from competitions or old imports.

  • Sending frequency.

    Sending more often usually lowers the rate per email even when total revenue goes up.

Common mistakes when using benchmarks

Chasing open rate.

It's the least reliable figure on this page. Use it as a deliverability warning, not a goal.

Comparing with the wrong group.

A global average or another sector may not tell you much about your list.

Comparing campaign figures with flow figures.

They do different jobs, so keep them separate.

Looking at one send.

One email can be unusual. Look at the trend over several months.

Cutting sends to protect rates.

Fewer, better-targeted emails can help, but judge the change on revenue rather than on rates alone.

What do we look at in the first weeks of an audit?

When we audit an account, the benchmarks above are one input, not the verdict.

Week 1: the data.

We pull open, click, unsubscribe, complaint and revenue figures for campaigns and flows separately. We also check how your platform calculates them.

Week 1: deliverability.

We check SPF, DKIM and DMARC, plus spam complaint rates against Google's guidelines.

Week 2: the gaps.

We compare your figures with your own trend and with the right benchmark, then find where the biggest gaps sit: list health, segments, flows, content or send times.

Week 2: the plan.

You get the gaps in order of likely impact, with what we'd fix first.

Frequently asked questions

  • What is the average open rate for email marketing in the UK?

    The DMA's Email Benchmarking Report 2025 puts it at 35.9% for emails sent in 2024. Averages vary between studies and industries, so compare yourself with your own sector and your own trend over time.

  • What is a good open rate in Klaviyo?

    Many healthy Klaviyo accounts see campaign open rates between 35% and 60% for engaged audiences. Whole-list figures will be lower.

  • Why has my open rate suddenly changed?

    Usually it's a deliverability problem, a change in who you're sending to or a change in how opens are tracked. Check inbox placement first, then look at your segments.

  • Is click rate more important than open rate?

    For judging whether an email worked, yes. Clicks show real interest and are far less affected by privacy tools. Revenue per recipient is better still.

  • How often should we compare our figures with benchmarks?

    Check your own figures every month and compare with industry benchmarks every few months. We refresh this page every six months.

  • What is a good click rate for email marketing?

    The DMA's Email Benchmarking Report 2025 puts the UK average unique click rate at 2.3% for emails sent in 2024. As with opens, compare with your own trend first. Automated flows usually click higher than campaigns.

  • What is click-to-open rate?

    Unique clicks divided by unique opens. It shows how well the email worked for people who opened it, so it's a useful check on content and design. Because it relies on opens, privacy tools can affect it too.

  • How do we measure revenue per recipient?

    Divide the revenue attributed to an email by the number of people it was delivered to. Check which attribution window your platform uses, because it decides which orders count.

  • What is the average email open rate by industry?

    The DMA doesn't publish UK sector figures openly, so we use Mailchimp's global benchmarks from December 2023. They put eCommerce at 29.81%, business and finance at 31.35%, education and training at 35.64% and non-profits at 40.04%. The all-industry average is 35.63%. Compare with your own trend too, because how you count opens changes the picture.

  • What is a good unsubscribe rate?

    There's no openly published UK benchmark. Mailchimp's global average across all industries is 0.22%, from its December 2023 benchmarks. A steady rate around that level is normal. A rising unsubscribe rate usually means you're sending too often or to the wrong people. Unsubscribes do far less damage than spam complaints, so don't make it hard to leave.

  • What is an acceptable spam complaint rate?

    Google's email sender guidelines ask senders to keep their spam rate in Postmaster Tools below 0.1% and never let it reach 0.3%. Go over that and your emails can start landing in spam for everyone, not only the people who complained. If you send more than 5,000 messages a day to Gmail, one-click unsubscribe is also required.

  • Are email open rates still reliable?

    Less than they were. Apple Mail Privacy Protection and image blocking change how opens are counted. Google says itself that it doesn't track open rates and that low open rates aren't necessarily a sign of deliverability problems. Use opens as an early warning sign. Judge performance on clicks, revenue per recipient and spam complaints.

  • Does sending more emails lower open rates?

    Usually, yes. Sending more often tends to lower the rate per email, even when total revenue goes up. That's why we judge frequency changes on revenue per recipient over several sends rather than on open rate alone. Sending more to engaged subscribers while easing off on people who rarely open is often the best balance.

  • What is the difference between open rate and click rate?

    Open rate is the share of delivered emails that were opened. Click rate is the share of delivered emails where someone clicked a link. Opens mostly reflect your sender name, subject line and deliverability. Clicks reflect your content, design and offer. In the UK, the DMA puts the 2024 averages at 35.9% for opens and 2.3% for clicks.

Want to know how your list compares?

  • No long contracts. If we’re not delivering you can leave. We’d rather earn the next month than lock you in.
  • Permanent specialists on your account. Strategists, CRM specialists and designers who work for us, not freelancers.
  • No sales team. Your first call is with the people who would actually run your account.
Klaviyo Partner
Paddy Cumiskey, Head of Email & CRM at Climb & Conquer

Tell us about your account and one of our email specialists will compare your open, click and revenue figures with your industry, then show you where the gaps are.

Free, with no hard sell.

Claim your free email audit